What’s YOUR Plan This Election Day?

Thank you AAPD for contributing to this post

Did you know that in 2016, 25% of the total electorate–62.7 million eligible voters–either had a disability or were living with a household member with a disability?
The voter turnout rate of people with disabilities, however, was 6% lower than people without disabilities. If the turnout rate had been equal, an additional 2.2 million more people would have voted in 2016 (Doug Kruse & Lisa Schur, Rutgers University).
A contributing factor was polling place accessibility. Of the 178 polling places observed in 2016, the US Government Accountability Office (GAO) reported 107 (60%) had one or more impediments to access.
What’s your plan this November? How will you cast YOUR ballot?
If you are unsure or have had challenges voting in the past, check out Prepare in Advance of Election Day and Troubleshooting Problems on Election Day. Additional AT Tips for Voting cover what to expect from accessible voting equipment and more options for casting a ballot.
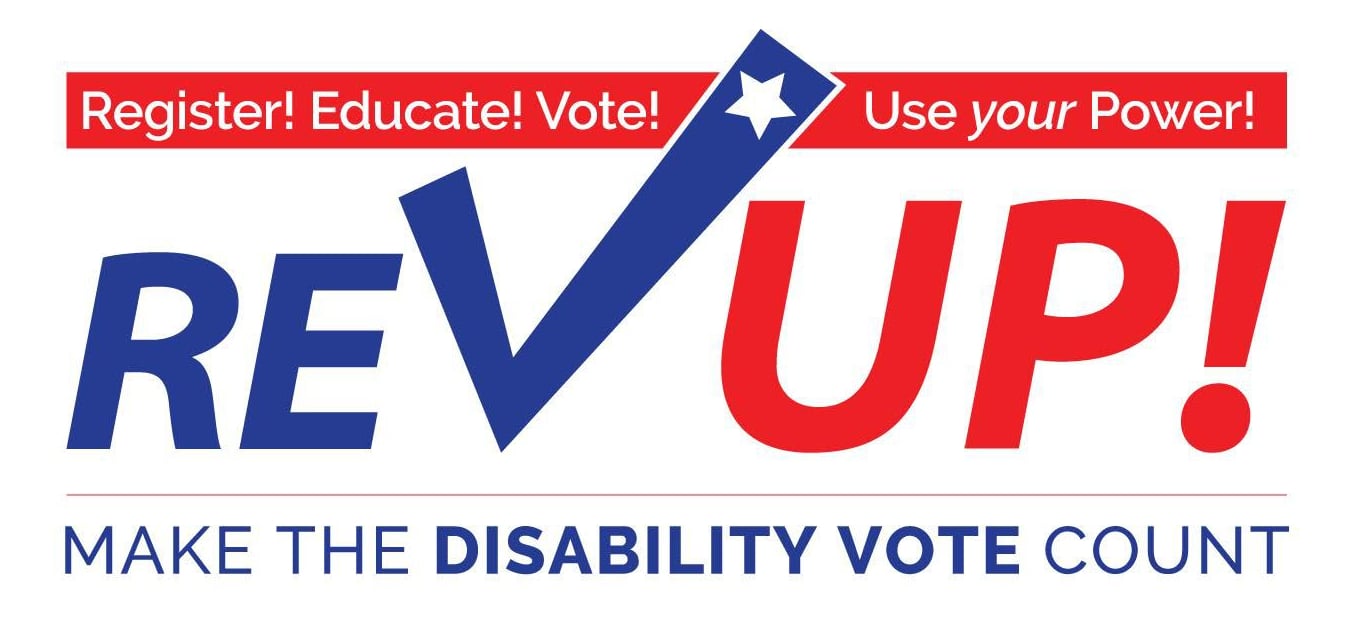
Make your best plan. #REVUP the #DisabilityVote2018!
Monthly Blog Digest
Search the blog
State AT Program Blogs
California
Florida
Indiana
Kentucky
Louisiana
Maryland
Massachusetts
Michigan
Montana
North Carolina
North Dakota
Utah
State AT Program Blogs
The AT3 Center, the Association of AT Act Programs (ATAP), and the Administration on Community Living (ACL) make no endorsement, representation, or warranty expressed or implied for any product, device, or information set forth in this blog. The AT3 Center, ATAP, and ACL have not examined, reviewed, or tested any product or device hereto referred.


